


NSE vs BSE is usually discussed in terms of trading volumes, indices and market share.
But their FY26 financial numbers reveal something far more interesting.
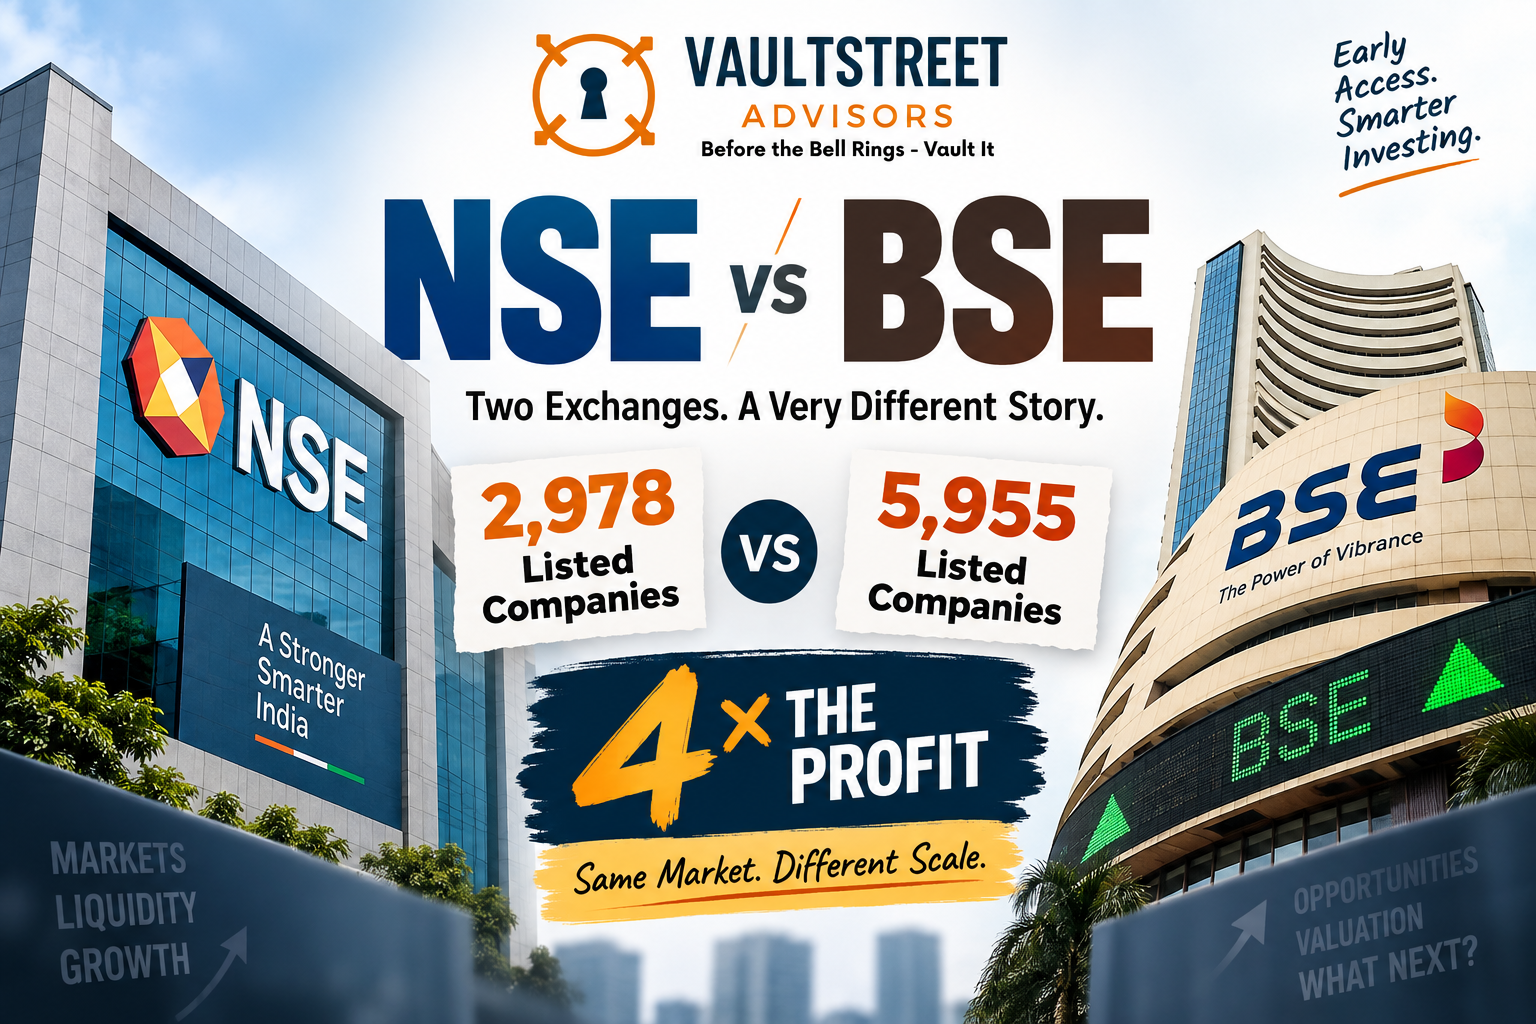
BSE has nearly twice as many listed companies as NSE. Yet NSE generates more than 3× the operating revenue and roughly 4× the profit.
How?
The answer provides an important lesson about how stock exchanges actually make money—and why liquidity, transaction volumes, derivatives activity and network effects can matter much more than the number of companies listed on an exchange.
For investors evaluating NSE unlisted shares and the NSE IPO, this comparison is particularly relevant.
At VaultStreet Advisors, we looked beyond the headline numbers to understand what separates India’s two major stock exchanges—and what those differences could mean for NSE’s valuation as it moves from the unlisted market towards public listing.
NSE vs BSE FY26: The Numbers
Here is the FY26 comparison:
| Metric | NSE | BSE |
|---|---|---|
| Revenue from Operations | ₹16,601 Cr | ₹4,834 Cr |
| Transaction Charges | ₹13,057 Cr | ₹3,795 Cr |
| Operating EBITDA | ₹11,098 Cr | ₹3,079 Cr |
| Operating EBITDA Margin | ~67% | ~64% |
| PAT / Profit attributable to shareholders* | ₹10,302 Cr | ~₹2,497 Cr |
*Reporting classifications between NSE and BSE are not identical. Investors should refer to the respective financial statements for precise definitions.
The first takeaway is obvious:
NSE operates at a dramatically larger financial scale.
NSE generated approximately 3.4 times BSE’s revenue from operations in FY26.
Its transaction-charge revenue was also approximately 3.4 times larger.
And its reported profit was roughly four times BSE’s.
But the next number makes this comparison much more interesting.
BSE Has More Listed Companies. So Why Does NSE Make More Money?
As of March 2026, BSE reportedly had approximately 5,955 listed entities.
NSE had approximately 2,978.
In other words:
BSE: ~5,955 listed entities
NSE: ~2,978 listed entities
Yet their represented market capitalisations were broadly similar at around ₹411 lakh crore.
So BSE has almost twice as many listed companies, while NSE produces substantially higher transaction revenue and profit.
That tells investors something fundamental about the stock-exchange business.
More listings do not necessarily mean more economics.
For an exchange, what matters enormously is:
- trading turnover;
- institutional participation;
- liquidity available to buyers and sellers;
- derivatives volumes;
- transaction frequency;
- market share;
- clearing and settlement activity; and
- the ability to monetise its network.
This is where NSE’s scale becomes formidable.
1. NSE Dominates India’s Cash Equity Market
NSE’s disclosures indicate that it commanded approximately 92.99% market share in India’s cash market by turnover during FY26.
That is an extraordinary competitive position.
Why does it matter?
Because liquidity itself can create a powerful competitive advantage.
Investors generally prefer trading where there are more buyers and sellers.
More participants create more liquidity.
More liquidity attracts more participants.
More participants generate more transactions.
And more transactions generate greater opportunities for transaction-related revenue.
This creates the classic network effect.
For a stock exchange, that network can become an extremely powerful economic moat.
2. NSE’s Dominance Is Even Greater in Derivatives
NSE’s strength becomes even more striking in equity derivatives.
FY26 disclosures indicated NSE market shares of approximately:
Equity Futures: 99.79% by turnover
Equity Options: 74.71% based on premium turnover
Exchange-Traded Currency Futures: 99.48%
Exchange-Traded Currency Options: 100% based on premium turnover
This helps explain why NSE’s transaction-charge income is so large.
But investors should look at both sides.
A dominant derivatives franchise produces enormous scale—but dependence on derivatives also creates regulatory risk.
SEBI has introduced multiple measures aimed at strengthening risk management and addressing excessive speculative activity in equity derivatives.
For a detailed perspective on what has been happening among individual F&O traders, read this analysis from our associated broking platform:
For somebody evaluating NSE as a business, derivatives therefore represent both:
a formidable competitive advantage and a regulatory concentration risk.
3. Stock Exchanges Can Be Exceptionally Scalable Businesses
Another striking feature of the NSE vs BSE comparison is profitability.
NSE’s FY26 operating EBITDA margin was approximately:
67%
BSE’s was approximately:
64%
Both are exceptionally high compared with many conventional businesses.
An exchange requires substantial investment in:
- technology;
- trading infrastructure;
- cybersecurity;
- surveillance;
- clearing systems;
- regulatory compliance;
- data infrastructure; and
- operational resilience.
But once this infrastructure exists, transaction volumes can increase significantly without operating costs necessarily increasing at the same rate.
That creates operating leverage.
And it helps explain why successful exchange businesses can generate exceptionally strong margins.
4. But Don’t Make the Mistake of Thinking BSE Is Weak
NSE’s larger numbers tell only one part of the story.
BSE itself had a very strong FY26.
BSE’s revenue from operations increased from approximately ₹2,957 crore in FY25 to about ₹4,834 crore in FY26.
Its transaction-charge revenue increased from approximately ₹2,030 crore to about ₹3,795 crore.
BSE was therefore growing rapidly from a substantially smaller base.
Meanwhile, NSE’s revenue from operations declined modestly from approximately ₹17,141 crore in FY25 to ₹16,601 crore in FY26.
NSE’s PAT also declined from approximately ₹12,188 crore to ₹10,302 crore.
There are therefore two very different stories inside the NSE vs BSE comparison:
NSE = Dominant scale and market share
BSE = Smaller base but much stronger recent percentage growth
This distinction matters enormously when comparing valuations.
5. NSE vs BSE: Scale Is Not the Same as Valuation
This brings us to the question that matters particularly for NSE unlisted shareholders and potential IPO investors.
Is NSE’s superior business scale already reflected in its valuation?
A strong company does not automatically become a strong investment at every price.
NSE’s enormous market share, transaction ecosystem and profitability explain why its shares attracted considerable attention in India’s unlisted market.
But investors still need to ask:
How much should we pay for those advantages?
We examined exactly this question earlier in:
NSE Unlisted Shares Before the IPO: Opportunity, Valuation or FOMO?
That distinction between business quality and purchase valuation becomes even more important as NSE transitions towards its public listing.
6. NSE IPO Price vs Unlisted Share Price: Why This Comparison Matters
For years, investors wanting exposure to NSE had to acquire shares through the unlisted market.
The IPO changes that equation.
And this transition has created an important valuation discussion for investors who bought NSE shares at different prices in the unlisted market.
We have analysed that issue separately in:
Bought NSE Unlisted Shares Above ₹2,000? What the ₹1,785 IPO Price Could Mean for Investors
The lesson goes well beyond NSE:
Buying a company before its IPO does not automatically mean buying it cheaply.
An investor must still evaluate:
- earnings;
- valuation;
- growth;
- comparable listed companies;
- liquidity;
- regulatory risks;
- IPO pricing; and
- the price already paid in the unlisted market.
This is precisely where the NSE vs BSE comparison becomes useful.
BSE gives investors a publicly traded comparable against which NSE’s economics and eventual valuation can be assessed.
7. What NSE’s Listing Could Change
Until now, comparing NSE and BSE as investments has been difficult.
BSE is publicly traded.
NSE has historically traded in the unlisted market.
Once NSE becomes listed, investors should be able to compare the two continuously across:
- P/E valuation;
- market capitalisation;
- revenue growth;
- transaction volumes;
- market share;
- EBITDA margins;
- earnings growth;
- return ratios;
- dividends;
- regulatory exposure; and
- new business opportunities.
That could make NSE vs BSE one of India’s most closely watched financial-infrastructure comparisons.
For readers looking at the NSE IPO specifically from the public-market perspective, our associated platform Riddhi Siddhi Share Brokers has covered the issue here:
NSE IPO 2026: Price, Dates, SEBI Approval & What Investors Should Know
NSE Is Bigger. Does That Automatically Make It the Better Investment?
No.
This is perhaps the most important takeaway from the entire comparison.
A better business is not automatically the better investment at every valuation.
NSE’s dominant market share is important.
Its liquidity advantage is important.
Its profitability is important.
Its network effect is important.
But so is the price an investor pays.
Consider a hypothetical example.
If Company A earns ₹100 and grows at 10%, while Company B earns ₹30 but grows at 40%, which is the better investment?
There isn’t enough information to answer.
We still need to know:
What valuation are we paying for each?
The same principle applies to NSE and BSE.
What Should NSE Investors Watch From Here?
Instead of simply asking “Is NSE better than BSE?”, investors should monitor five things.
1. Market Share
Can NSE maintain its extraordinary dominance, particularly in cash equities and derivatives?
2. BSE’s Growth
Can BSE continue gaining transaction volumes and monetising its rapidly expanding business?
3. Regulation
How will regulatory changes—particularly around derivatives—affect NSE’s trading volumes and transaction revenues?
4. Earnings Growth
NSE is dramatically larger today.
But which exchange can compound earnings faster from here?
5. Valuation
Finally—and perhaps most importantly:
What price are investors paying for each rupee of future earnings?
That question can completely change the investment equation.
NSE vs BSE: The Bigger Lesson for Pre-IPO Investors
The most fascinating numbers in this entire comparison may actually be:
BSE: ~5,955 listed entities
versus
NSE: ~2,978 listed entities
Despite this, NSE generates more than three times BSE’s operating revenue and roughly four times its profit.
Why?
Because in an exchange business:
Liquidity can matter more than listings.
Trading activity can matter more than company count.
Network effects can matter more than conventional size.
But for a pre-IPO investor, there is one additional lesson:
A great business still needs to be bought at a sensible valuation.
This principle applies not only to NSE but to virtually every company trading in India’s unlisted and pre-IPO market.
VaultStreet Advisors View
NSE’s FY26 financials demonstrate why the exchange has developed into one of India’s most powerful financial-market institutions.
Its market share, liquidity, transaction ecosystem and profitability create a formidable franchise.
At the same time, BSE’s recent growth should not be ignored.
The real question for an investor therefore isn’t simply:
NSE or BSE—which business is bigger?
The better questions are:
What growth is already priced in?
What risks could change that growth?
And what valuation are we paying today?
At VaultStreet Advisors, we believe pre-IPO investing should begin with understanding the business, financials, valuation, liquidity and risks—not merely with the expectation that an IPO will automatically generate returns.
Explore unlisted and pre-IPO opportunities at VaultStreet Advisors.
Message +91 99875 53455 to request access to our exclusive WhatsApp community for daily prices, opportunities and market updates.
VaultStreet Advisors
Before the bell rings… Vault it!
Disclaimer
VaultStreet Advisors is a boutique platform facilitating unlisted share transactions. We do not provide investment advisory services. All investments are subject to market risks. Please consult your financial advisor.
This article is intended solely for educational and informational purposes. Financial figures have been rounded where appropriate, and investors should independently verify current financial information, IPO details, valuations and applicable regulations before making any investment decision. Past performance, market share or historical financial performance does not guarantee future results.